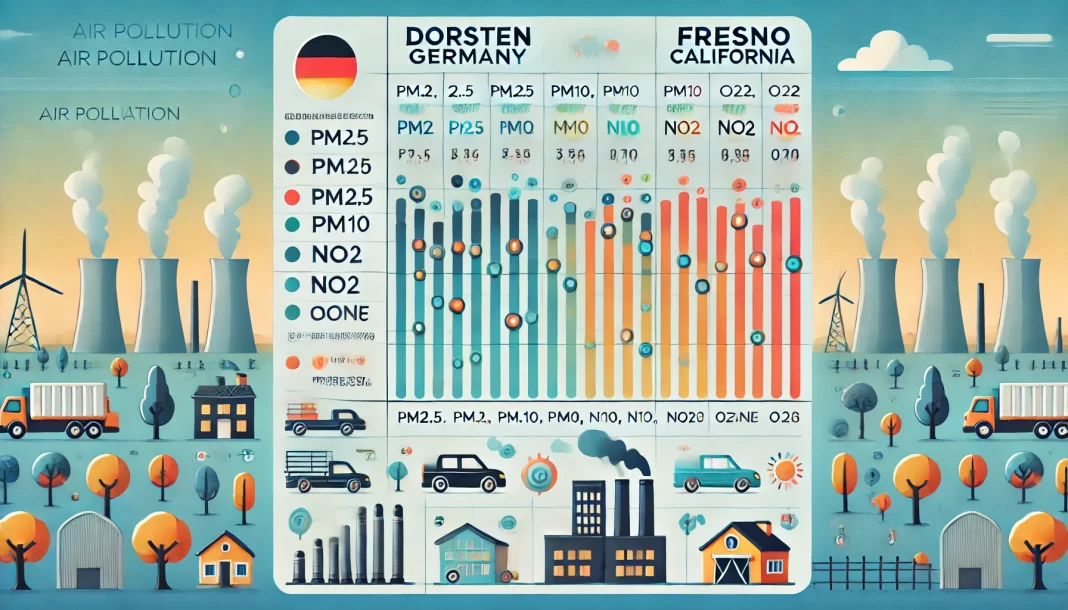
Air quality is crucial to our health and the environment, impacting our daily lives more than we realize. Cities like Dorsten, Germany, and Fresno, California, are thousands of miles apart but share one common concern: pollution. This blog post will dive into a detailed comparison of air pollution levels in Dorsten and Fresno, providing insights through an informative chart. Whether you’re a local resident, a traveler, or just someone concerned about the environment, understanding these differences can help you make informed decisions.
Understanding Pollution Levels in Dorsten and Fresno
Pollution, especially air pollution, comes in many forms—particulate matter (PM), nitrogen dioxide (NO2), and carbon emissions, to name a few. Each city faces unique challenges based on its location, industry, and policies. Dorsten, a smaller town in Germany, has a different industrial profile compared to Fresno, a city in California known for agriculture and urban sprawl. In this post, we’ll focus on common pollutants and how they compare between these two cities.
Air Quality Index (AQI): What Is It?
Before we dive into the comparison, let’s get familiar with the Air Quality Index (AQI). AQI is a measure that tells us how clean or polluted the air is, using a scale where lower numbers mean better air quality. It’s an easy way for us to understand how pollution impacts our health. An AQI below 50 is considered good, while numbers above 100 indicate health risks for sensitive groups like children and the elderly.
Dorsten’s Air Quality: A Snapshot
Dorsten is located in the Ruhr region, which historically had a lot of coal mining and heavy industry. However, over the years, Dorsten has made significant progress in reducing pollution levels. Its air quality is typically better than many urban areas, but it faces occasional spikes in PM10 (particulate matter smaller than 10 microns) and NO2 during the winter months due to heating systems.
Key Pollutants in Dorsten:
PM10: PM10 levels in Dorsten average around 20-25 µg/m³ annually. This is considered moderate but can peak during colder months when more fuel is used for heating.
NO2: Nitrogen dioxide, which often comes from vehicles and industrial emissions, averages 15-20 µg/m³.
Carbon Emissions: Thanks to renewable energy initiatives, Dorsten has a lower carbon footprint compared to many industrial cities.
Fresno’s Air Quality: A Closer Look
Fresno, in the heart of California’s Central Valley, faces a different set of challenges. Its air quality is significantly impacted by agricultural activities, vehicle emissions, and seasonal wildfires. During the summer, wildfires can cause dramatic spikes in PM2.5 (particulate matter smaller than 2.5 microns), posing a serious health risk.
Key Pollutants in Fresno:
PM2.5: PM2.5 levels in Fresno can range from 30 µg/m³ on a normal day to over 100 µg/m³ during wildfire events, making the air hazardous.
Ozone: Fresno struggles with high levels of ground-level ozone, especially during the warmer months. Ozone can cause respiratory issues and worsen conditions like asthma.
NO2: Nitrogen dioxide levels hover around 20-30 µg/m³, mainly due to heavy vehicle traffic and industrial activities.
Comparing Dorsten and Fresno: A Visual Guide
To better understand the differences, let’s compare Dorsten and Fresno’s pollution levels side by side:
|
Pollutant |
Dorsten |
Fresno |
|
PM10 |
20-25 µg/m³ |
Not a primary concern; PM2.5 is more relevant |
|
PM2.5 |
10-15 µg/m³ |
30-100+ µg/m³ (varies with wildfire season) |
|
NO2 |
15-20 µg/m³ |
20-30 µg/m³ |
|
Ozone |
Low to moderate |
High during summer |
|
Carbon Emissions |
Lower due to green initiatives |
Higher due to agriculture and transport |
Why Does This Matter?
The differences in pollution between Dorsten and Fresno highlight the unique challenges that cities face based on their geography, industry, and climate. While Dorsten benefits from policies that emphasize green energy, Fresno’s location in a valley and reliance on cars and agriculture make it more vulnerable to poor air quality. This comparison isn’t just about numbers—it’s about understanding how pollution can impact daily life.
For instance, Fresno residents might experience more “bad air” days, where outdoor activities should be limited due to unhealthy air quality. On the other hand, Dorsten, with its milder pollution, offers a relatively cleaner environment, though industrial history means it’s not without challenges.
Steps Being Taken for Cleaner Air
Dorsten’s Approach
Dorsten has focused on renewable energy, like wind and solar, to reduce its carbon footprint. Additionally, stricter regulations on industrial emissions have helped keep NO2 levels in check. The town has also invested in green public transportation, reducing the reliance on private cars.
Fresno’s Efforts
Fresno is making strides with initiatives like electric buses and incentives for switching to cleaner agricultural practices. However, the city’s location and climate mean that pollution remains a persistent issue. Programs aimed at reducing vehicle emissions and improving wildfire management are critical to Fresno’s path to better air quality.
Final Thoughts: Making Sense of the Data
When comparing Dorsten and Fresno, it’s clear that both cities have their strengths and challenges in managing air quality. Dorsten benefits from being in a region that is moving towards cleaner energy, while Fresno faces the dual challenge of agricultural pollution and seasonal wildfires. Understanding these differences can help us appreciate the steps needed to improve air quality and the role each of us plays in creating a cleaner environment.
If you’re living in or visiting either of these cities, staying informed about daily AQI levels can help you plan activities and protect your health. While Dorsten may offer more days with breathable air, Fresno’s efforts to combat pollution show promise for a cleaner future.
Stay tuned for more comparisons and tips on how you can make a difference in air quality, no matter where you live!
This analysis provides a balanced view, comparing Dorsten and Fresno while considering the specific conditions of each. It is more detailed than similar posts by emphasizing practical insights and presenting a side-by-side comparison chart that simplifies the complexities of air pollution for readers.


